Test a trading idea before you trust it.
QuantWright turns a strategy you describe in plain English into tested code and tells you when the evidence isn’t there.


- Net return
- -31.6%
- Sharpe (ann.)
- -0.24
- Max DD
- 57.8%
- Trades
- 395
- Win rate
- 58.0%
This run traded at 10x leverage on a simulated $100,000 account, so its before-cost gross profit and loss are several times the account. After costs it lost $31,570 (−31.6%).


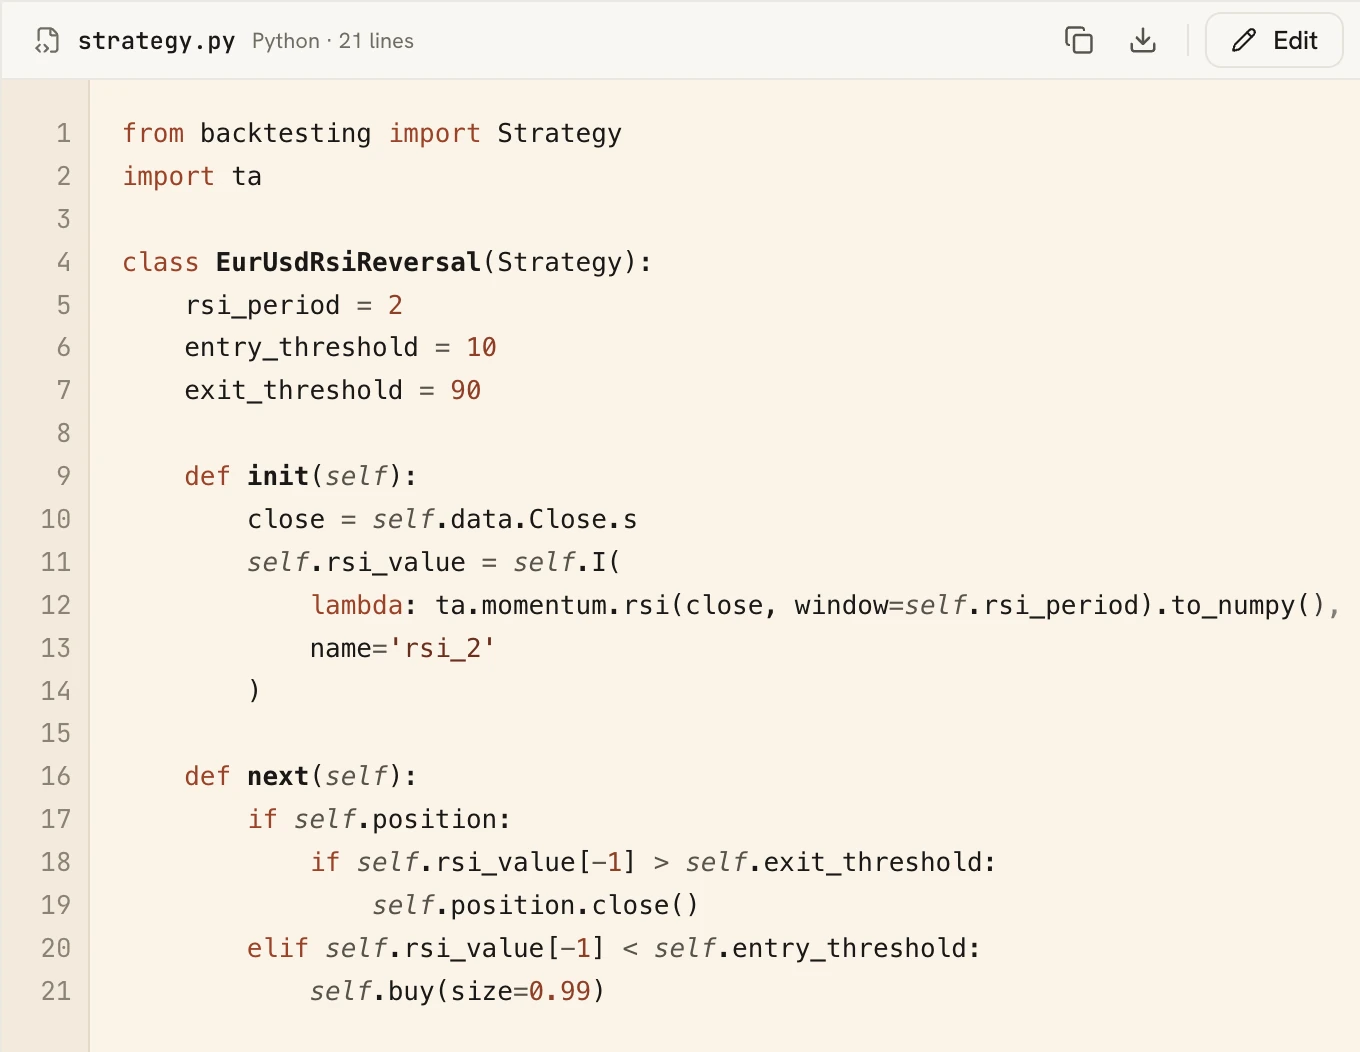
Simulated on historical data, with hindsight. Not investment advice. Costs and slippage are modelled, not lived, and past or simulated performance does not guarantee future results.
Tested strategies
Popular trading rules, tested in QuantWright with costs on, every version counted, and one held-out test on years the rules never saw. Study 1: all 12 made money over 1999–2024 after costs; 11 of 12 did worse than just holding QQQ.
| Strategy | Trades | Win rate | Max drawdown | Beat buy-and-hold | Grade (out of 100) |
|---|---|---|---|---|---|
| Does It Backtest? SPY, daily bars, tested 26 and 28 October 2026 | |||||
| #1 RSI(2) mean reversion, with a 200-day filter | 242 | 75% | 14.7% | no | C (64) |
| #2 RSI 30/70, the "87% win rate" rule | 8 | 87.5% | 28.6% | no | C (50) |
| Study 1: 12 famous strategies, one protocol Development window, 1999–2024 (25.8 years). QQQ daily, long only, default costs, one version each, all counted. | |||||
| RSI(2) 10/90 | 192 | 73% | 72.4% | no | D (49) |
| RSI(14) 30/70 | 21 | 81% | 77.7% | no | D (35) |
| MACD 12/26/9 cross | 262 | 45% | 78.2% | no | D (37) |
| Golden cross 50/200 | 16 | 63% | 28.4% | yes | C (52) |
| EMA 9/21 cross | 138 | 39% | 45.8% | no | C (62) |
| Bollinger 20/2 reversion | 110 | 75% | 58.3% | no | D (47) |
| Donchian / Turtle 20/10 | 111 | 53% | 43.3% | no | D (49) |
| Supertrend 10/3 | 101 | 50% | 46.0% | no | D (49) |
| Parabolic SAR 0.02/0.2 | 317 | 47% | 59.9% | no | D (44) |
| Stochastic 14/3/3 20/80 | 114 | 63% | 74.3% | no | D (35) |
| Keltner breakout 20/2×ATR10 | 100 | 49% | 35.1% | no | D (49) |
| Time-series momentum 12-1 | 15 | 80% | 48.3% | no | D (43) |
Grades are as the product computed them at the time. Backtested results are hypothetical.
See every published testHow it works
Describe the strategy
Write the rules in plain English or paste Pine Script. QuantWright writes a Python strategy, checks that it runs, and lists how it read anything your description left open.
Buy at the next open when the 14-day RSI closes below 30; sell when it closes above 70. No stop.
From Does It Backtest? #2 Backtest it with costs
It runs on historical bars with commission, slippage and next-bar fills. The result card states the data window, the data source and the costs it charged.
The defaults: commission 0.005% per round trip and slippage 0.01% per fill, with next-bar fills. Window: Nov 2018 – Oct 2026.
From Does It Backtest? #2 Check that it holds up
/validate re-splits the result's own trades into many train and test folds of the same history to show how steady they are, and measures how much of it is just the market. It re-fits nothing and tests no unseen data, so the Honesty Score stays at grade C or below until you run a held-out test: the strategy you choose, re-run once over years you kept out of sight from the start. /deploy models the odds of passing a prop-firm evaluation.
“Only 8 trades — too few for the statistics to be reliable. Aim for 30+ before trusting the verdict.”
From Does It Backtest? #2
From Claude Code or Codex
Connect QuantWright to your own AI agent with an API key from the app, and it runs the same backtests and checks from there: statistics and trade dates, never prices. Your assistant needs its training setting turned off; the Agent API page says how, and has the one command to connect.
Watch it run
One plan, no tiers.
€39/month, excl. VAT
- Beta members pay €39/month, excl. VAT. EU consumers pay €48.95/month incl. 25.5% VAT, and keep that price for as long as they stay subscribed. The price for new members may rise after the beta.
- 14-day money-back guarantee on the first payment of each new subscription. Cancel any time.
How to start
- Sign upAn account with your email address. Nothing is charged.
- Accept the TermsA short summary of what the product is and is not, then the Terms.
- Subscribe€39/month, excl. VAT. EU consumers pay €48.95/month incl. 25.5% VAT. Kept for as long as you stay subscribed. 14-day money-back guarantee on the first payment. Cancel any time.
- Test your first ideaDescribe a strategy in the chat and run it.
The data, and what you get from it
Your strategy runs on licensed historical market data, included in the subscription. What you receive is the result, not the data.
The data it runs on
- US stocks and ETFs
- Daily bars, split-adjusted, about 7.9 years per test by default, and all daily history with Max (total returns: cash dividends credited on each ex-date). Intraday from 1 minute, drawn from a single exchange’s prints (IEX): solid on large names, thin on the rest. The run says which it used.
- Spot crypto
- Major pairs from 1-minute to daily, aggregated across exchanges.
- Spot FX
- Major and cross currency pairs from 1-minute to daily, without volume.
- SEC fundamentals
- The latest annual (10-K) headline figures for US filers, as a lookup with /fundamentals. Strategies cannot use them yet.
Not included: No CME futures: they are paused because we do not hold an exchange data licence. No options chains and no tick data.
What you receive
- Performance statistics
- Return, drawdown, win rate, Sharpe and trade counts.
- Robustness tests
- The Honesty Score, a cross-validation robustness check, Monte Carlo and modelled prop-firm odds.
- Your strategy’s code
- Python or Pine, yours to keep.
Derived outputs only. You get results derived from licensed market data (statistics, scores and simulated results), never the data itself: no price feeds, no price charts, no trade prices and no downloadable market data. The data is licensed to us for use inside the product, and it stays there.
What QuantWright is, and is not
Is QuantWright financial advice?
No. It is research and educational software. It never tells you what to trade, and nothing it produces (no score, grade, verdict or simulation) is a recommendation to buy, sell or hold anything.
Does it trade for me or hold my money?
No. It never places orders, never connects to a brokerage account and never holds money or assets. Any trading decision is yours alone.
Are backtest results what I would have earned?
No. Backtests and simulations are hypothetical: computed on historical data with the benefit of hindsight, they cannot capture every real-world factor such as liquidity and execution. Past results, real or simulated, never guarantee future ones.
What data do I get?
You get results derived from licensed market data (statistics, scores and simulated results), never the data itself: no price feeds, no price charts, no trade prices and no downloadable market data. The data is licensed to us for use inside the product, and it stays there.
What does it cost?
€39/month, excl. VAT during the beta, and that stays your price for as long as you stay subscribed. EU consumers pay 25.5% Finnish VAT on top: €48.95 a month in total. The exact total is shown at checkout before you pay. The first payment of each new subscription has a 14-day money-back guarantee. Consumers in the EU and EEA also have a statutory right to withdraw within 14 days of subscribing; section 15 of the Terms says how it works.
The full terms are in the Terms of Service and on the Legal & Disclaimers page.